Jesús Alastruey Benedé and Pablo Ibáñez Marín
Computer Architecture group (gaZ)
Department of Computer Science and Systems Engineering
Universidad de Zaragoza
March-2024
We aim to study the performance of the scale_shift
kernel on an x86 system:
        for (unsigned int i = 0; i < LEN; i++)
            x[i] = alpha * x[i] + beta;
To achieve this, we will analyze the performance of two vectorized
versions: avx2 and avx2+fma. The kernel will be executed multiple times
to facilitate timing measurements and analysis with
perf.
The code was compiled using gcc 12.2.1.
The following link shows the relevant source code and the assembly for
both versions:
https://godbolt.org/z/xbfjbrn9r
The executed commands and the machine and assembly code for the kernel in each version are:
$ gcc -O3 -mavx2 ... -o ss.1k.single.vec.avx.gcc
$ objdump -Sd ss.1k.single.vec.avx.gcc
  4012d8:   c5 e4 59 00             vmulps (%rax),%ymm3,%ymm0
  4012dc:   48 83 c0 20             add    $0x20,%rax
  4012e0:   c5 fc 58 c2             vaddps %ymm2,%ymm0,%ymm0
  4012e4:   c5 fc 29 40 e0          vmovaps %ymm0,-0x20(%rax)
  4012e9:   48 39 c3                cmp    %rax,%rbx
  4012ec:   75 ea                   jne    4012d8 <scale_shift+0x58>
The loop code occupies 22 bytes. The decoded instructions translate into 7 uops.
$ gcc -O3 -mavx2 -mfma -ffast-math ... -o ss.1k.single.vec.avxfma.gcc
$ objdump -Sd ss.1k.single.vec.avxfma.gcc
  4012f8:   c5 fc 28 c3             vmovaps %ymm3,%ymm0
  4012fc:   c4 e2 6d 98 00          vfmadd132ps (%rax),%ymm2,%ymm0
  401301:   48 83 c0 20             add    $0x20,%rax
  401305:   c5 fc 29 40 e0          vmovaps %ymm0,-0x20(%rax)
  40130a:   48 39 c3                cmp    %rax,%rbx
  40130d:   75 e9                   jne    4012f8 <scale_shift+0x58>
The loop code occupies 23 bytes, one more than the avx version. Decoded instructions are converted into 7 uops.
When executing both versions on a core of a system with an Intel
i5-9500 processor [1] (eighth generation, Coffee Lake [2]), model 158
(0x9E), stepping 10 (0xA), with x[] being a vector of 1024
float elements, the following results are obtained:
| Version | time(ns) | R(GFLOPS) |
|---|---|---|
| AVX2 | 45.1 | 45.4 |
| AVX2+FMA | 64.4 | 31.8 |
The performance of the avx+fma version is 50% worse than expected.
The experimental results do not match those provided by the uiCA tool [3], which estimates a performance of 1.25 cycles per iteration for both versions:
It should be noted that this tool assumes ideal execution conditions (no frontend stalls).
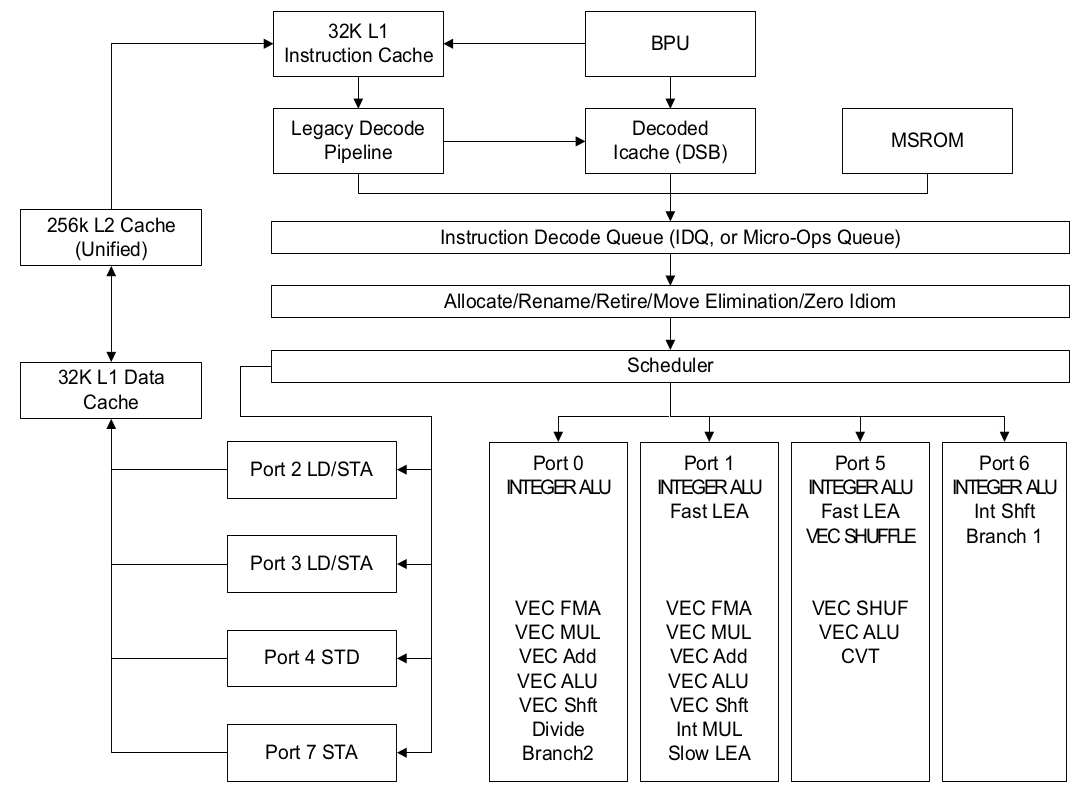
We will analyze the code execution using the toplev tool
[4], which applies the TMAM methodology [5].
First, we collect execution statistics for both versions:
$ toplev.py -l1 -v --no-desc -- binary| Version | Frontend_Bound | Bad_Speculation | Backend_Bound | Retiring |
|---|---|---|---|---|
| AVX2 | 6.7 | 7.3 | 1.6 | 84.5 |
| AVX2+FMA | 36.0 | 3.7 | 1.3 | 59 |
The Frontend_Bound metric value is higher for the avx+fma code.
$ toplev --describe Frontend_Bound^
Frontend_Bound
    This category represents fraction of slots where the
    processor's Frontend undersupplies its Backend. Frontend
    denotes the first part of the processor core responsible to
    fetch operations that are executed later on by the Backend
    part. Within the Frontend; a branch predictor predicts the
    next address to fetch; cache-lines are fetched from the
    memory subsystem; parsed into instructions; and lastly
    decoded into micro-operations (uops). Ideally the Frontend
    can issue Pipeline_Width uops every cycle to the Backend.
    Frontend Bound denotes unutilized issue-slots when there is
    no Backend stall; i.e. bubbles where Frontend delivered no
    uops while Backend could have accepted them. For example;
    stalls due to instruction-cache misses would be categorized
    under Frontend Bound.
Next, we focus on the avx+fma version.
toplev suggests a new execution specifying second-level
metrics to obtain more information about the frontend issue:
$ toplev.py --nodes '!+Frontend_Bound*/2,+MUX' -v --no-desc -- ss.1k.single.vec.avxfma.gcc
[...]
FE       Frontend_Bound                  % Slots               36.0
FE       Frontend_Bound.Fetch_Latency    % Slots                0.8  <
FE       Frontend_Bound.Fetch_Bandwidth  % Slots               35.2   <==
[...]
Run toplev --describe Fetch_Bandwidth^ to get more information on bottleneck
Add --run-sample to find locations
Add --nodes '!+Fetch_Bandwidth*/3' for breakdown.
The identified bottleneck metric is fetch bandwidth:
$ toplev --describe Fetch_Bandwidth^
Frontend_Bound.Fetch_Bandwidth
    This metric represents fraction of slots the CPU was stalled
    due to Frontend bandwidth issues.  For example;
    inefficiencies at the instruction decoders; or restrictions
    for caching in the DSB (decoded uops cache) are categorized
    under Fetch Bandwidth. In such cases; the Frontend typically
    delivers suboptimal amount of uops to the Backend.
The segmentation front-end schema can facilitate the analysis of this metric:
Again, toplev suggests a run to obtain third-level
metrics related to fetch bandwidth:
$ toplev.py -v --nodes '!+Fetch_Bandwidth*/3' --no-desc -- ss.1k.single.vec.avxfma.gcc
[...]
FE       Frontend_Bound.Fetch_Bandwidth       % Slots               35.2    [50.0%]
FE       Frontend_Bound.Fetch_Bandwidth.MITE  % Slots_est            0.0  < [50.0%]
FE       Frontend_Bound.Fetch_Bandwidth.DSB   % Slots_est           47.5    [50.0%]
FE       Frontend_Bound.Fetch_Bandwidth.LSD   % Slots_est            0.0  < [50.0%]
According to these results, the DSB is not delivering a sufficient number of uops to the IDQ.
$ toplev --describe Fetch_Bandwidth.DSB^
[...]
Frontend_Bound.Fetch_Bandwidth.DSB
    This metric represents Core fraction of cycles in which CPU
    was likely limited due to DSB (decoded uop cache) fetch
    pipeline.  For example; inefficient utilization of the DSB
    cache structure or bank conflict when reading from it; are
    categorized here.
[...]
The avx version does not exhibit this problem:
$ toplev.py -v --nodes '!+Fetch_Bandwidth*/3' --no-desc -- ss.1k.single.vec.avx.gcc
[...]
FE       Frontend_Bound.Fetch_Bandwidth       % Slots                3.8  < [50.0%]
FE       Frontend_Bound.Fetch_Bandwidth.MITE  % Slots_est            0.8  < [50.0%]
FE       Frontend_Bound.Fetch_Bandwidth.DSB   % Slots_est            2.2  < [50.0%]
FE       Frontend_Bound.Fetch_Bandwidth.LSD   % Slots_est            0.0  < [50.0%]
[...]
Let’s analyze the issue with the DSB in more detail. First, we will obtain two metrics related to this structure:
$ toplev --describe DSB
[...]
DSB_Coverage
    Fraction of Uops delivered by the DSB (aka Decoded ICache;
    or Uop Cache). See section 'Decoded ICache' in Optimization
    Manual. http://www.intel.com/content/www/us/en/architecture-
    and-technology/64-ia-32-architectures-optimization-
    manual.html
[...]
DSB_Misses
    Total pipeline cost of DSB (uop cache) misses - subset of
    the Instruction_Fetch_BW Bottleneck.
[...]

$ toplev.py --nodes '!+DSB_Coverage,DSB_Misses' -v -- ss.1k.single.vec.avxfma.gcc
[...]
Info.Frontend    DSB_Coverage    Metric                       1.00   [33.4%]
Info.Botlnk.L2   DSB_Misses      Scaled_Slots                 0.02   [33.3%]
[...]
The results indicate that:
Thus, it seems the problem stems from inefficient utilization of the
DSB. Let’s confirm this with perf by querying counters
related to the Frontend_Bound.Fetch_Bandwidth.DSB metric:
$ perf stat -e cycles,idq.all_dsb_cycles_any_uops,idq.all_dsb_cycles_4_uops -- ss.1k.single.vec.avxfma.gcc
[...]
     4,430,039,972      cycles
     4,286,052,577      idq.all_dsb_cycles_any_uops
        79,579,968      idq.all_dsb_cycles_4_uops
We observe that during almost all cycles, the DSB is not delivering enough uops to the IDQ. Comparing it with the avx version:
$ perf stat -e cycles,idq.all_dsb_cycles_any_uops,idq.all_dsb_cycles_4_uops -- i5-9500/ss.1k.single.vec.avx.gcc
[...]
     3,146,269,244      cycles
     2,461,132,491      idq.all_dsb_cycles_any_uops
     2,252,366,626      idq.all_dsb_cycles_4_uops
[...]
For this code, we observe that around 25% of the time, uops are not supplied to the IDQ.
Next, let’s study the layout of both code versions in memory:
The first-level instruction cache (L1I) has a size of 32 KiB and is
organized into 64 sets of 8 ways, with 64-byte blocks.
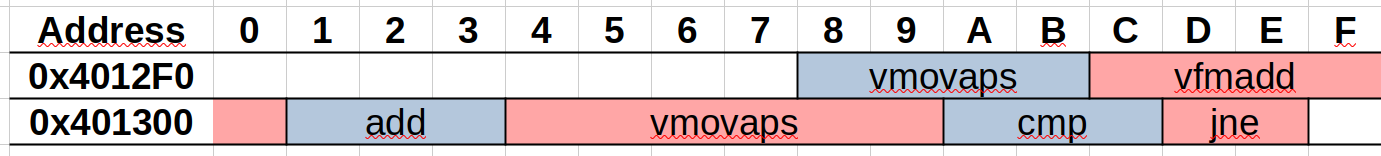
Thus, the loop will be distributed across two distinct blocks: the first
15 bytes in set 11, and the rest in set 12.
| Address | Tag | Set | byte/block |
|---|---|---|---|
0x4012F0 |
0100 0000 0001 | 0010 11 | 11 0000 |
0x401300 |
0100 0000 0001 | 0011 00 | 00 0000 |
According to the collected hardware counters, this layout in L1I does
not seem to affect performance.
In the avx code, the loop is stored entirely in a single instruction
cache block, block 11.
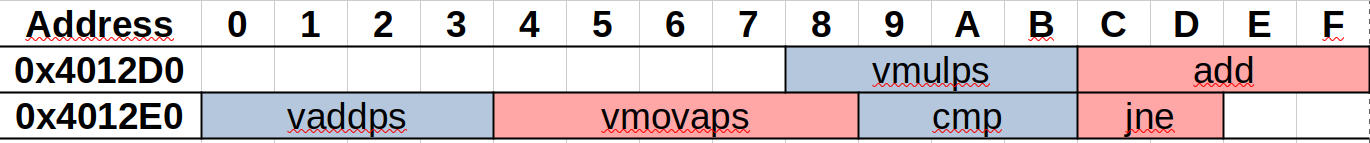
| Address | Tag | Set | byte/block |
|---|---|---|---|
0x4012D0 |
0100 0000 0001 | 0010 11 | 01 0000 |
0x4013E0 |
0100 0000 0001 | 0010 11 | 10 0000 |
Next, we analyze how the decoded instructions are stored in the
DSB.
We must consider the following restriction [6]:
All uops in a way must reside within the same 32-byte aligned block (Uops in way must be in 32B aligned window).
The vfmadd132ps instruction crosses a 32-byte boundary,
so its two uops are stored in a different way than the uops before and
after it.
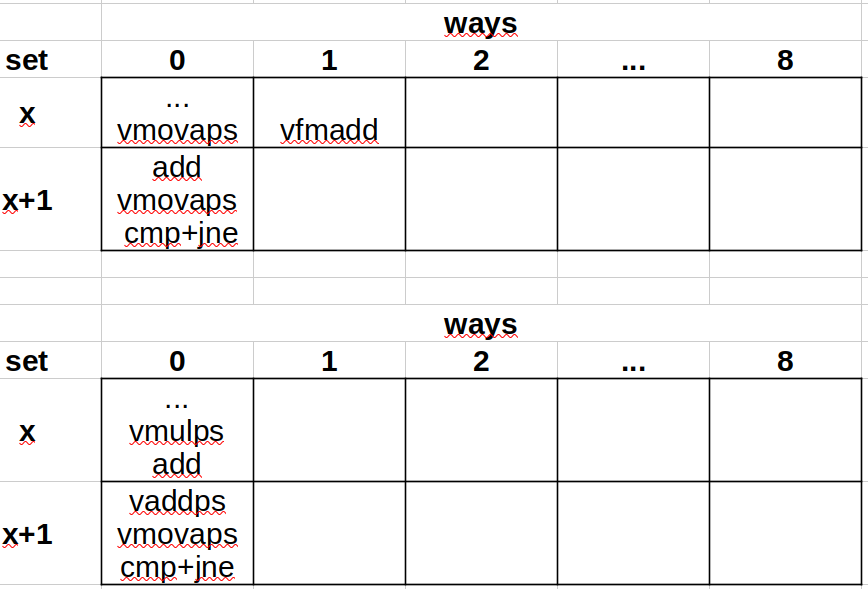
Thus, the avx loop is stored in two ways, while the avx+fma loop is
stored in three.
This may explain the 50% performance drop.
In this case, since the loop is small (23 bytes), we can prevent it from
crossing a 32-byte boundary by aligning it to this size.
To achieve this, we recompile the version with the
-falign-loops=32 option 1. The resulting code is
as follows:
  401325:   66 66 2e 0f 1f 84 00    data16 cs nopw 0x0(%rax,%rax,1)
  40132c:   00 00 00 00
  401330:   66 66 2e 0f 1f 84 00    data16 cs nopw 0x0(%rax,%rax,1)
  401337:   00 00 00 00
  40133b:   0f 1f 44 00 00          nopl   0x0(%rax,%rax,1)
  401340:   c5 fc 28 c3             vmovaps %ymm3,%ymm0
  401344:   c4 e2 6d 98 00          vfmadd132ps (%rax),%ymm2,%ymm0
  401349:   48 83 c0 20             add    $0x20,%rax
  40134d:   c5 fc 29 40 e0          vmovaps %ymm0,-0x20(%rax)
  401352:   48 39 c3                cmp    %rax,%rbx
  401355:   75 e9                   jne    401340 <scale_shift+0x70>
You can see that nops occupying 28 bytes have been added at the start of the loop. If we measure the performance of this new version:
| Version | time(ns) | R(GFLOPS) |
|---|---|---|
| AVX2+FMA | 43.5 | 47.1 |
This result is similar to that obtained by the avx version.
Hardware counters confirm that the DSB now delivers 4 uops per cycle to the IDQ:
$ perf stat -e cycles,idq.all_dsb_cycles_any_uops,idq.all_dsb_cycles_4_uops -- ss.1k.single.vec.avxfma.32loopalign.gcc
[...]
     2,989,151,487      cycles
     2,396,426,322      idq.all_dsb_cycles_any_uops
     2,332,210,100      idq.all_dsb_cycles_4_uops
[...]The ICX 2023.2 compiler achieves better performance thanks to unrolling by a factor of 4:
| comp. | version | time(ns) | R(GFLOPS) |
|---|---|---|---|
| GCC | AVX2 | 45.3 | 45.2 |
| AVX2+FMA | 64.5 | 31.8 | |
| ICX | AVX2 | 35.0 | 58.5 |
| AVX2+FMA | 30.2 | 67.8 |
We executed the avx and avx+fma versions, both with and without the 32-byte loop alignment option, on a core of a system with an Intel i5-1240P processor (12th generation, Alder Lake), model 154 (0x9A), stepping 3. Results are shown in the following table:
| comp. | versión | tiempo(ns) | R(GFLOPS) |
|---|---|---|---|
| GCC | AVX2 | 38.8 | 52.8 |
| AVX2 alin. | 39.5 | 51.8 | |
| AVX2+FMA | 34.9 | 58.7 | |
| AVX2+FMA al. | 34.1 | 60.1 | |
| ICX | AVX2 | 31.7 | 64.6 |
| AVX2+FMA | 20.4 | 100.8 |
On this processor, loop misalignment does not penalize the performance of the avx+fma version.
The avx+fma version compiled with icx exceeds 100
GFLOPS.
[1] Intel® Core™ i5-9500 Processor. https://www.intel.com/content/www/us/en/products/sku/134895/intel-core-i59500-processor-9m-cache-up-to-4-40-ghz/specifications.html
[2] Coffee Lake - Microarchitectures - Intel. https://en.wikichip.org/wiki/intel/microarchitectures/coffee_lake
[3] uiCA - The uops.info Code Analyzer. https://uica.uops.info/
[4] pmu-tools. https://github.com/andikleen/pmu-tools
[5] A. Yasin, “A Top-Down method for performance analysis and counters architecture”. 2014 IEEE International Symposium on Performance Analysis of Systems and Software (ISPASS), Monterey, CA, USA, 2014, pp. 35-44, doi: 10.1109/ISPASS.2014.6844459. https://ieeexplore.ieee.org/document/6844459
[6] Causes of Performance Swings Due to Code Placement in IA. https://llvm.org/devmtg/2016-11/Slides/Ansari-Code-Alignment.pdf. https://www.youtube.com/watch?v=IX16gcX4vDQ
Description of Intel events: https://perfmon-events.intel.com/ https://perfmon-events.intel.com/
How to monitor the full range of CPU performance events. https://bnikolic.co.uk/blog/hpc-prof-events.html
The mystery of an unstable performance. http://pzemtsov.github.io/2014/05/12/mystery-of-unstable-performance.html
32-byte aligned routine does not fit the uops cache. https://stackoverflow.com/questions/61016077/32-byte-aligned-routine-does-not-fit-the-uops-cache
pmu-tools part I. http://halobates.de/blog/p/245
From Top-down Microarchitecture Analysis to Structured Performance Optimizations. https://cassyni.com/events/YKbqoE4axHCgvQ9vuQq7Cy
Top-Down performance analysis methodology. https://easyperf.net/blog/2019/02/09/Top-Down-performance-analysis-methodology
Code alignment issues. https://easyperf.net/blog/2018/01/18/Code_alignment_issues
The default value of this option is 0:
-falign-loops=0.↩︎